Aller au contenu principal
FIG 0.0 · REPORTS

All your numbers, in oneplace.

13 analytics tabs in a single rail — sales, revenue, hours, email, SMS — plus a 3-step builder to create your own. The report shows up by email on its own, and Oracle can build it for you.

Free 14-day trial

No credit card required.

Reports and analytics dashboards from toncrm.io
FIG 0.1 · THE RAIL

13 tabs. One single page.

A Gmail-style side rail (56→224 px on hover), and you jump from sales to job-costing without changing screens. Click a tab to see.

12 pre-configured reports wait for you on your first visit — 2 per feature, ready to tweak. You never start from a blank page.

FIG 0.2 · HOURS + OVERHEAD

Your true margin per job.

The Hours report allocates your overhead per client project — pro-rated on direct hours or on direct labor cost. You can exclude a cost-plus or T&M project from the base. It's real cost accounting, not a bogus % markup.

vs the others: SMB CRMs give you raw hours. Nobody allocates overhead to jobs like a cost-accounting system — built for the QC contractor.
Method: direct labor cost
Réno Bouchard
142 h direct
+ 4 260 $
Toiture Néon
88 h direct
+ 2 640 $
Garage Lavoie (T&M)
61 h direct
excluded
Overhead allocated pro-rata · CSV export · visible to owner/admin/manager.
82% of sends trackable
M
T
W
T
F
S
S
0h12h23h
The golden slot = your best time to send (Tuesday morning here).
FIG 0.3 · HONEST EMAIL

Your email stats, without padding them.

We show the % actually trackable instead of selling you a fake open rate. Opens and clicks only count for contacts who consented — native Law 25 / GDPR strict mode. As a bonus, a 7-day × 24-hour heatmap to know when to send.

FIG 0.4 · SMS 100% TRACKED

Every SMS tracked, not guessed.

Delivery rate, failures, opt-outs, inbound replies — tracked 100% via Twilio's StatusCallback. No pixel to guess like with email: an SMS is either delivered or not, and you know it.

98,2 %
Delivery
1,8 %
Failures
0,4 %
Opt-out
37
Replies
Breakdown by number + top recipients
FIG 0.5 · BUILDER

Your own report, in 3 steps.

Source → visualization → permissions. A stepper, a recap, and it's saved. 7 data sources, 8 chart types, 3 visibility levels.

1
Source
Pipeline, revenue, clients, operations, marketing, team — or a custom object.
2
Visualization
Bars, lines, funnel, heatmap, table, KPI card… 8 types.
3
Permissions
Private, shared to the org, or reserved for specific roles.
« Revenue » digest — every Monday 8 a.m.
to you + your accountant
Public link copied
toncrm.io/r/a3f9… · valid 30 d · revocable
FIG 0.6 · DELIVERY

The report shows up on its own.

Schedule a daily, weekly or monthly digest — it goes out by email without you touching it. For the banker or the accountant, generate a public link by token, expirable and revocable. No account to create, no access to your CRM.

FIG 0.7 · ORACLE

Ask. Oracle builds the report for you.

« Build me a monthly revenue report by stage » → Oracle creates it, gives you the link, and can analyze it with a comparison vs the previous period. It can also list all your reports in plain language.

3 tools: create a report, analyze it (delta vs previous period), list the visible reports. All in plain language.
Build a monthly revenue report by stage
Oracle
✓ Report created — « Monthly revenue by stage ». Link ready, visible to your org.
Analyze it vs last month
Oracle
Revenue up 14% vs the previous month — driven by the Proposal stage. Details in the report.
FIG 0.8 · THE DETAILS THAT MATTER

The kind of stuff you only notice when it's missing elsewhere.

Report on your custom objects
Any custom object in your org (inventory, equipment, files) becomes a report: total, new over the period, breakdown by status field.
Anomaly detection
Your MRR drops 30% from one period to the next? An email + an alert fire on their own, based on the threshold you set.
Province by province
QC / ON / BC breakdown on revenue, contacts and deals. Canada-native, rare in an SMB CRM.
12 ready-to-use presets
Two reports per feature, auto-installed on your first visit. You tweak instead of starting from a blank page.
Visibility by role
Private, shared to the org or reserved for certain roles. Amounts hide from anyone who isn't allowed to see them.
8 visualization types
Bars, lines, areas, pie, funnel, heatmap, table, KPI card — the same engine everywhere.
FIG 0.9 · ZERO EXTERNAL BI

No need for Tableau or Looker.

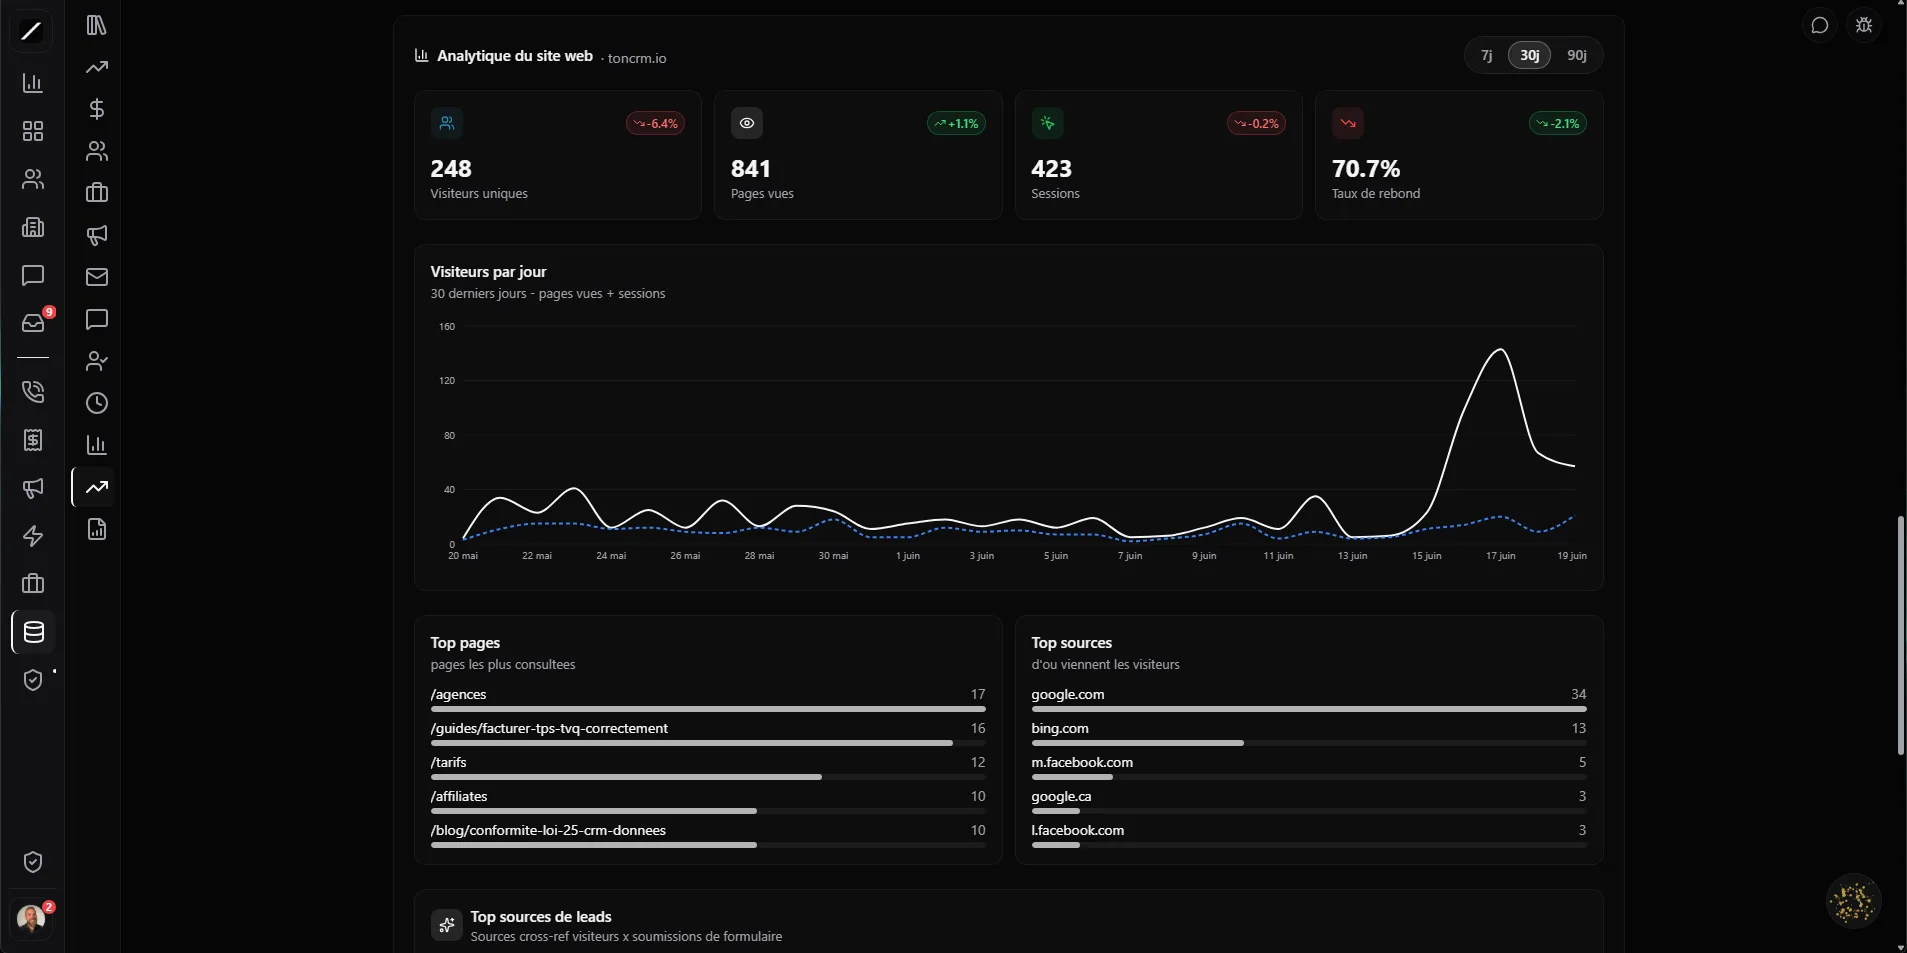
Your analytics are native in the CRM, wired straight to your real data — zero BI tool to plug in, zero export to sync, zero extra cost. Law 25 + PIPEDA compliant, and web analytics runs through self-hosted Umami, with no third-party script.

FIG 1.0 · FAQ

Everything about reports.

13 tabs in a single rail: All, Sales, Revenue, Clients, Operations, Marketing, Email, SMS, Team, Hours, Analytics, Reporting and Custom. Plus a builder to create your own.

Yes — overhead allocation pro-rated on direct hours or labor cost, per client project, with cost-plus projects excludable from the base. Real cost accounting, not a fixed markup.

Yes — scheduled daily, weekly or monthly digests, sent to your recipients without a single click.

Yes — a token-based public link, expirable and revocable, to hand to your accountant or your banker. No login required.

We honestly show the percentage of emails actually trackable instead of padding the open rate, with a strict Law 25 / GDPR mode. SMS, on the other hand, are tracked 100% via Twilio.
L'entrepreneur d'aujourd'hui
FIG 1.1 · GET STARTED

See all your numbers.

14 days free, no card. Or book a demo and we'll set up your reports for your trade.

Free 14-day trial

We'll set up your reports for your trade in a 45-sec demo.

Essai gratuit 14 joursAppeler Clodyne

Ready to see toncrm.io for real? We show it to you set up for your trade.

Book a 15-minute demo — or start your free trial right away.

Free 14-day trial

No credit card · Setup done for you · French-language support

Features